
Brain size, IQ, and racial-group differences:Evidence from musculoskeletal traits
J. Philippe Rushton*, Elizabeth W. Rushton
Intelligence 31 (2003) 139 – 155
Abstract
A review of the world literature on brain size and IQ by Rushton [Rushton, J. P. (1995). Race, evolution, and behavior: a life history perspective. New Brunswick, NJ: Transaction] found that African-descended people (Blacks) average cranial capacities of 1267 cm3 , European-descended people (Whites) 1347 cm3 , and East Asian-descended people (East Asians) 1364 cm3 . These brain size differences, containing millions of brain cells and hundreds of millions of synapses, were hypothesized to underlie the race differences on IQ tests, in which Blacks average an IQ of 85, Whites 100, and East Asians 106.
Across the three populations, the ‘‘ecological correlations’’ [Jensen, A. R. (1998). The g factor. Westport, CT: Praeger] between brain size and the 37 morphological traits averaged a remarkable r = .94; r = .94.
If the races did not differ in brain size, these correlations could not have been found. It must be concluded that the race differences in average brain size are securely established. As such, brain size-related variables provide the most likely biological mediators of the race differences in intelligence.
1. Introduction
Among individuals, intelligence is related to brain size. This has been documented in about two dozen studies using magnetic resonance imaging (MRI) to measure brain volume.
Altogether there are now about 15 studies on over 700 subjects showing that individuals with larger brain volumes have higher IQ scores.
The races differ in average brain size and this shows up at birth. Rushton (1997) analyzed the enormous US data set known as the Collaborative Perinatal Project.
It recorded head circumference measurements and IQ scores from 50,000 children followed from birth to age 7 (Broman, Nichols, Shaugnessy, & Kennedy, 1987).
The results showed that at birth, 4 months, 1 year, and 7 years, the East Asian children in the study averaged larger cranial volumes than did the White children, who averaged larger cranial volumes than did the Black children.
Within each race, the children with the larger head sizes had the higher IQ scores and by age 7, the East Asian children averaged an IQ of 110, White children an IQ of 102, and Black children an IQ of 90.
Moreover, the East Asian children, who averaged the largest craniums, were the shortest in stature and the lightest in weight, whereas the Black children, who averaged the smallest craniums, were the tallest in stature and the heaviest in weight. Therefore, the race differences in brain size were not due to body size.
Many are surprised to learn that the races differ in brain size (e.g., Brody, in press; Graves, 2002; Kamin & Omari, 1998; Lieberman, 2001) and they question how reliable the evidence is.
In fact dozens of studies from the 1840s to the 1990s, using different methods on different samples, reveal the same strong pattern.
Four different methods of measuring brain size— MRI, endocranial volume measured from empty skulls, wet brain weight at autopsy, and external head size measurements—all produce the same results.
Using MRI, for example, Harvey, Persaud, Ron, Baker, and Murray (1994) found that 41 Africans and West Indians had a smaller average brain volume than did 67 Caucasians.
Their study found that East Asians, Europeans, and Africans averaged cranial volumes of 1415, 1362, and 1268 cm3 , respectively.
More recently, Ho, Roessmann, Straumfjord, and Monroe (1980) found in an autopsy study of 1261 American adults, that 811 White Americans averaged 1323 g and 450 Black Americans averaged 1223 g—a difference of 100 g. Since the Blacks and Whites in the study were similar in body size, differences in body size cannot explain away the differences in brain weight.
A final way of estimating brain size is by cranial volume calculated from external head size measurements (length, width, height).
The results again confirm the racial differences.
In the most comprehensive of these studies, Rushton (1992) calculated average cranial capacities for East Asians, Whites, and Blacks from a stratified random sample of over 6000 U.S. Army personnel. The East Asians, Whites, and Blacks averaged 1416, 1380, and 1359 cm3 , respectively.
2. Method
The three populations under consideration have mean absolute cranial capacities of African Americans (1356 cm3 ), European Americans (1371 cm3 ), and East Asian Americans (1383 cm3 ). These cranial sizes are taken from the stratified random sample of over 6000 U.S.
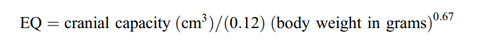
The average EQ is defined as 1.0. Monkeys and apes have large brains relative to their body size (EQs = 1.0 to 5.0). Human EQs are over 6, which is about three times larger than would be expected for a typical primate of our body size. Although alternative exponents have been debated, the most widely used equation is:
3. Results

Absolute and relative brain size (Traits 1 and 4) intercorrelated 1.00, and both correlated with a mean r of .94 (median = 1.00) across the 37 traits. They showed similar high correlations across the separate trait categories, viz., on 11 cranial traits
Brain size correlated with the 31 traits that remained with mean Pearson and Spearman correlations of .96 (median = 1.00).
4. Discussion
As brain size increases from 1356 to 1383 cm3 across the three racial groups, 37 musculoskeletal traits vary accordingly with a remarkable mean r = .94, r = .94.
Nonetheless, it is noteworthy that the correlations with racial differences in brain size are as high for the 12 lower limb traits (Traits 30–41; r = .98) as they are for the 11 cranial traits (Traits 5–15, r = .91).
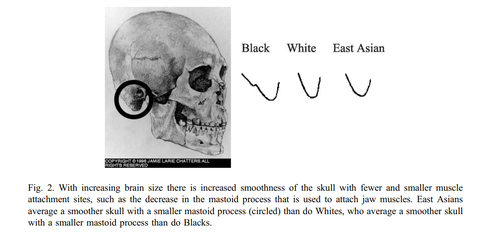
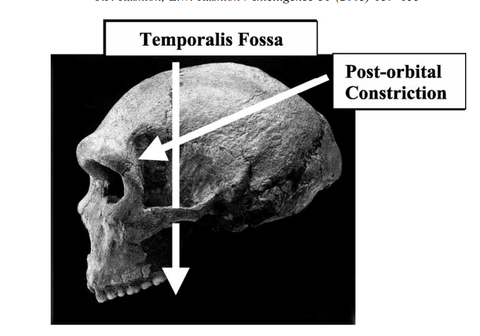
Fig. 3. With increasing brain size there are decreases in the postorbital constriction and temporalis fossae, which are indentations to allow the temporalis and masseter muscles, the large jaw-closing muscles, to run through and close the heavy jaw. East Asians average less postorbital constriction than do Whites, who average less postorbital constriction than do Blacks.

Fig. 4. With increasing brain size there is decreased prognathism and a flatter face. Muscles are no longer available to hold up a heavy forward jutting jaw. East Asians average a flatter face than do Whites, who average a flatter face than do Blacks.

Fig. 5. With increasing brain size, there is increased bicondylar breadth of the mandible, a widening of the upper back-of-the-jaw, which provides its attachment to the cranium. East Asians (left) average a wider upper back-ofthe-jaw than do Whites (right), who average a wider upper back-of-the-jaw than do Blacks (not shown). A similar pattern is observed for the lower jaw.
J. Philippe Rushton*, Elizabeth W. Rushton
Intelligence 31 (2003) 139 – 155
先行研究紹介が極めて印象的で、大文字にしておいた部分は、7歳以下の子度を対象としたものであり、計測が正しいのであれば、白人・黒人・東洋人(事実上は中国人)の間の生物学的な差を認めざるを得ない。7歳時点でのIQテストは、完全に有効であり、ほとんど環境の影響を受けない。
しかし、
①日本人による測定では、1326cm3(容積)、重量では1,350~1,400とされている
日本人は、白人よりも小さい値である。体格差がそのまま反映されている。
ただし、日本人の脳容量に関する論文が、日本語・英語で、論文検索1ページ目でヒットしない
②女性の脳容量は、体格差から明らかに男性よりも小さな値であるのに、IQテストの結果に明確な差が存在しないことは言うまでもない。
③このため、EQ=encephalization quotientという下記の式を使う
④この論文では上の式によりEQ値算出しており、白人・黒人・東洋人(事実上は中国人)の間に差が生じている
⑤しかし、霊長類を対象にしたb場合には、EQなど意味がないとする引用数の多い下記論文がある。霊長類ではEQではなく、脳容量の絶対値が重要だそうだ。ヒト以外の霊長類では恐らくは正解であろう
Overall Brain Size, and Not EncephalizationQuotient, Best Predicts Cognitive Ability acrossNon-Human Primates
⑥しかし、②からヒトにはあてはまらない
⑦重大なのは、韓国人どもは、脳容量を決定している遺伝子の一つである可能性が高いNBPF1遺伝子、NOTCH2NL遺伝子に大量の韓国人ども固有の変異を有していることである。特に、NOTCH2NL遺伝子のSNPは、ヒトとチンパンジー(=3歳児程度の知能)の差の原因である可能性が高いのだ。(小頭症の疾患原因遺伝子は、ASPM遺伝子である)
Abstract
A review of the world literature on brain size and IQ by Rushton [Rushton, J. P. (1995). Race, evolution, and behavior: a life history perspective. New Brunswick, NJ: Transaction] found that African-descended people (Blacks) average cranial capacities of 1267 cm3 , European-descended people (Whites) 1347 cm3 , and East Asian-descended people (East Asians) 1364 cm3 . These brain size differences, containing millions of brain cells and hundreds of millions of synapses, were hypothesized to underlie the race differences on IQ tests, in which Blacks average an IQ of 85, Whites 100, and East Asians 106.
Across the three populations, the ‘‘ecological correlations’’ [Jensen, A. R. (1998). The g factor. Westport, CT: Praeger] between brain size and the 37 morphological traits averaged a remarkable r = .94; r = .94.
If the races did not differ in brain size, these correlations could not have been found. It must be concluded that the race differences in average brain size are securely established. As such, brain size-related variables provide the most likely biological mediators of the race differences in intelligence.
1. Introduction
Among individuals, intelligence is related to brain size. This has been documented in about two dozen studies using magnetic resonance imaging (MRI) to measure brain volume.
Altogether there are now about 15 studies on over 700 subjects showing that individuals with larger brain volumes have higher IQ scores.
The races differ in average brain size and this shows up at birth. Rushton (1997) analyzed the enormous US data set known as the Collaborative Perinatal Project.
It recorded head circumference measurements and IQ scores from 50,000 children followed from birth to age 7 (Broman, Nichols, Shaugnessy, & Kennedy, 1987).
The results showed that at birth, 4 months, 1 year, and 7 years, the East Asian children in the study averaged larger cranial volumes than did the White children, who averaged larger cranial volumes than did the Black children.
Within each race, the children with the larger head sizes had the higher IQ scores and by age 7, the East Asian children averaged an IQ of 110, White children an IQ of 102, and Black children an IQ of 90.
Moreover, the East Asian children, who averaged the largest craniums, were the shortest in stature and the lightest in weight, whereas the Black children, who averaged the smallest craniums, were the tallest in stature and the heaviest in weight. Therefore, the race differences in brain size were not due to body size.
Many are surprised to learn that the races differ in brain size (e.g., Brody, in press; Graves, 2002; Kamin & Omari, 1998; Lieberman, 2001) and they question how reliable the evidence is.
In fact dozens of studies from the 1840s to the 1990s, using different methods on different samples, reveal the same strong pattern.
Four different methods of measuring brain size— MRI, endocranial volume measured from empty skulls, wet brain weight at autopsy, and external head size measurements—all produce the same results.
Using MRI, for example, Harvey, Persaud, Ron, Baker, and Murray (1994) found that 41 Africans and West Indians had a smaller average brain volume than did 67 Caucasians.
Their study found that East Asians, Europeans, and Africans averaged cranial volumes of 1415, 1362, and 1268 cm3 , respectively.
More recently, Ho, Roessmann, Straumfjord, and Monroe (1980) found in an autopsy study of 1261 American adults, that 811 White Americans averaged 1323 g and 450 Black Americans averaged 1223 g—a difference of 100 g. Since the Blacks and Whites in the study were similar in body size, differences in body size cannot explain away the differences in brain weight.
A final way of estimating brain size is by cranial volume calculated from external head size measurements (length, width, height).
The results again confirm the racial differences.
In the most comprehensive of these studies, Rushton (1992) calculated average cranial capacities for East Asians, Whites, and Blacks from a stratified random sample of over 6000 U.S. Army personnel. The East Asians, Whites, and Blacks averaged 1416, 1380, and 1359 cm3 , respectively.
2. Method
The three populations under consideration have mean absolute cranial capacities of African Americans (1356 cm3 ), European Americans (1371 cm3 ), and East Asian Americans (1383 cm3 ). These cranial sizes are taken from the stratified random sample of over 6000 U.S.
The average EQ is defined as 1.0. Monkeys and apes have large brains relative to their body size (EQs = 1.0 to 5.0). Human EQs are over 6, which is about three times larger than would be expected for a typical primate of our body size. Although alternative exponents have been debated, the most widely used equation is:
3. Results

Absolute and relative brain size (Traits 1 and 4) intercorrelated 1.00, and both correlated with a mean r of .94 (median = 1.00) across the 37 traits. They showed similar high correlations across the separate trait categories, viz., on 11 cranial traits
Brain size correlated with the 31 traits that remained with mean Pearson and Spearman correlations of .96 (median = 1.00).
4. Discussion
As brain size increases from 1356 to 1383 cm3 across the three racial groups, 37 musculoskeletal traits vary accordingly with a remarkable mean r = .94, r = .94.
Nonetheless, it is noteworthy that the correlations with racial differences in brain size are as high for the 12 lower limb traits (Traits 30–41; r = .98) as they are for the 11 cranial traits (Traits 5–15, r = .91).


Fig. 3. With increasing brain size there are decreases in the postorbital constriction and temporalis fossae, which are indentations to allow the temporalis and masseter muscles, the large jaw-closing muscles, to run through and close the heavy jaw. East Asians average less postorbital constriction than do Whites, who average less postorbital constriction than do Blacks.

Fig. 4. With increasing brain size there is decreased prognathism and a flatter face. Muscles are no longer available to hold up a heavy forward jutting jaw. East Asians average a flatter face than do Whites, who average a flatter face than do Blacks.

Fig. 5. With increasing brain size, there is increased bicondylar breadth of the mandible, a widening of the upper back-of-the-jaw, which provides its attachment to the cranium. East Asians (left) average a wider upper back-ofthe-jaw than do Whites (right), who average a wider upper back-of-the-jaw than do Blacks (not shown). A similar pattern is observed for the lower jaw.

コメント