
Whole Brain Size and General Mental Ability: AReviewJ.
Philippe Rushton & C. Davison Ankney
© 2009 The Author(s). Published by Taylor & Francis.
We review the literature on the relation between whole brain size and general mental ability (GMA) both within and between species.
Among humans, in 28 samples using brain imaging techniques, the mean brain size/GMA correlation is 0.40 (N = 1,389; p < 10−10); in 59 samples using external head size measures it is 0.20 (N = 63,405; p < 10−10).
In 6 samples using the method of correlated vectors to distill g, the general factor of mental ability, the mean r is 0.63.
Finally, we examine brain size and mental ability from an evolutionary and behavior genetic perspective.
This is our fifth review of the relation between brain size and general mental ability (GMA; Rushton & Ankney, 1995, 1996, 1997, 2007).
THE BRAIN SIZE/GMA RELATIONSHIP Introduction
Darwin’s cousin, Sir Francis Galton (1888), was the first to quantify the relation between brain size and GMA in living people. He multiplied head length by breadth by height and plotted the results against class of degree in more than 1,000 male undergraduates at Cambridge University. He reported that men who obtained high honors degrees had a brain size 2%–5% greater than those who did not.
Years later, Karl Pearson (1906) reanalyzed Galton’s data using the correlation coefficient he had invented for this type of analysis; he found r = 0.11.
Following World War II (1939–1945) and the revulsion evoked by Hitler’s racial policies, craniometry became associated with extreme forms of racial prejudice. Research on brain size and intelligence virtually ceased, and the literature underwent vigorous critiques (Gould, 1978, 1981; Kamin, 1974; Tobias, 1970). However, as we shall show, modern studies confirm many of the earliest observations.
Reaction Time Measures
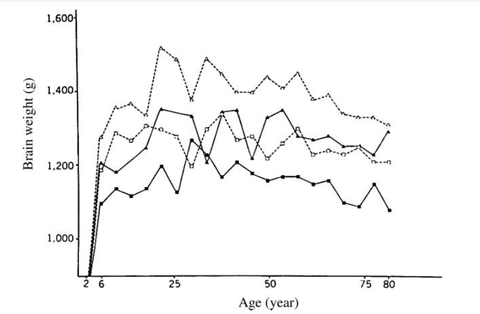
Figure 1. Mean brain weight for 4-year age periods in various subgroups. Brain weight is plotted at midpoint of each age period (e.g., the point at age 6 years represents the average for subjects between 4 and 8 years;
White men, open triangles;
Black men, solid triangles;
White women, open squares;
Black women, solid squares).
Differences in brain weights among various groups become apparent at age 6 years. (From Ho et al., 1980, p. 636, Figure 2.)
AGE DIFFERENCES Brain Size
Autopsy studies show that brain mass increases during childhood and adolescence and then, beginning as early as 20 years, slowly decreases through middle adulthood, and finally decreases more quickly in old age (Dekaban & Sadowsky, 1978; Ho et al., 1980; Pakkenberg & Voigt, 1964; Voigt & Pakkenberg, 1983).
Cognitive Ability
General intelligence shows concomitant increases during childhood and adolescence and then (slow) decreases between ages 25 and 45, and (faster) decreases after age 45.
SOCIOECONOMIC POSITION DIFFERENCES Brain Size
Nineteenth- and early twentieth-century data from Broca (1861) and others (Hooton, 1939; Sorokin, 1927; Topinard, 1878) suggested that people in higherstatus occupations averaged a larger brain or head size than those in lower ones.
Cognitive Ability
IQ test scores are significantly correlated with the socioeconomic hierarchies of modern Europe, North America, and Japan (Herrnstein & Murray, 1994;Jensen, 1998).
POPULATION GROUP DIFFERENCES
Brain Size
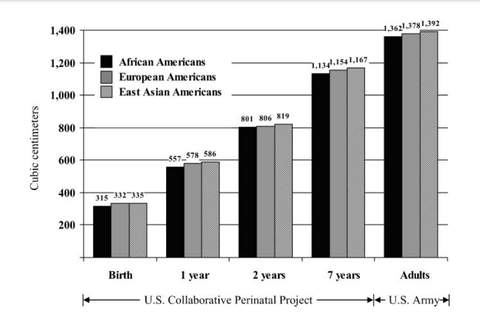
Figure 5. Mean cranial capacity (cm3) for African Americans, European Americans, and East Asian Americans from birth through adulthood. Data for birth through age 7 years from the U.S. Perinatal Project; data for adults from the U.S. Army data in Figure 4. (From Rushton, 1997, p. 15, Figure 2. Copyright 1997 by Ablex Publishing Corp. Reprinted with permission.).
Rushton (1997) analyzed population group differences from birth to age 7 years using measurements of head circumference and GMA gathered on 40,000 children by the U.S. Collaborative Perinatal Project (Broman et al., 1987). The results showed that at birth, 4 months, 1 year, and 7 years, the East Asian children averaged larger cranial volumes than White children who averaged larger cranial volumes than Black children (Figure 5).Within each group, children with larger head sizes obtained higher IQ scores.
Moreover, the East Asian children, who averaged the largest craniums, were the shortest in stature and the lightest in weight, whereas the Black children, who averaged the smallest craniums, were the tallest in stature and the heaviest in weight; the differences in brain size were not due to body size.
Philippe Rushton & C. Davison Ankney
© 2009 The Author(s). Published by Taylor & Francis.
知能と脳容量に関するレビュー論文である。第一区分を遺伝学論文としておく
紹介されている論文中に4万名ものサンプルを有する論文がある。図5では、
①6歳時点(脳容量)
アフリカ系アメリカ人1,134
ヨーロッパ系アメリカ人1,154
アジア系アメリカ人1,167
②成人
アフリカ系アメリカ人1,362
ヨーロッパ系アメリカ人1,378
アジア系アメリカ人1,392
これを、アフリカ系アメリカ人を基準とすると
③6歳時点
アフリカ系アメリカ人1.00
ヨーロッパ系アメリカ人1.0176=1.76%
アジア系アメリカ人1.0291=2.91%
④成人
アフリカ系アメリカ人1,362
ヨーロッパ系アメリカ人1.0117=1.17%
アジア系アメリカ人1.0220=2.2%
*アフリカ系アメリカ人とアジア系アメリカ人の6歳時点での差はかなり大きい。本文中でも著者2名が言及しているように、両者の体格の差を考慮すれば、実際には差がもっと大きい。サンプル数の多さから見て、実際に1%~3%の差があると認めざるを得ないことになってしまう。
*しかし、
①日本人による測定では、1326cm3(容積)、重量では1,350~1,400とされている
アフリカ系アメリカ人1,362よりもさらに少ない容積値である
②日本人に比べ白人の方が、脳重量は思いとする著作が存在する
体格差を考慮すれば、①②は極めて自然なことである。
従って、サンプル数は多いものの元データ論文の脳容量数値は?である。引用論文の測定方法を調べる必要なないであろう
身長、体重、脳重量(又は脳容量)、頭全周長さ、頭高さ、の5つを統合したデータでなければ全く意味がない。黒人は、頭幅と頭高の比が、東洋人に比べて、大きいと推定される。
従って、このレビュー論文は学術論文としては無価値に近い。紹介されている4万名のサンプルがある論文を探そう
We review the literature on the relation between whole brain size and general mental ability (GMA) both within and between species.
Among humans, in 28 samples using brain imaging techniques, the mean brain size/GMA correlation is 0.40 (N = 1,389; p < 10−10); in 59 samples using external head size measures it is 0.20 (N = 63,405; p < 10−10).
In 6 samples using the method of correlated vectors to distill g, the general factor of mental ability, the mean r is 0.63.
Finally, we examine brain size and mental ability from an evolutionary and behavior genetic perspective.
This is our fifth review of the relation between brain size and general mental ability (GMA; Rushton & Ankney, 1995, 1996, 1997, 2007).
THE BRAIN SIZE/GMA RELATIONSHIP Introduction
Darwin’s cousin, Sir Francis Galton (1888), was the first to quantify the relation between brain size and GMA in living people. He multiplied head length by breadth by height and plotted the results against class of degree in more than 1,000 male undergraduates at Cambridge University. He reported that men who obtained high honors degrees had a brain size 2%–5% greater than those who did not.
Years later, Karl Pearson (1906) reanalyzed Galton’s data using the correlation coefficient he had invented for this type of analysis; he found r = 0.11.
Following World War II (1939–1945) and the revulsion evoked by Hitler’s racial policies, craniometry became associated with extreme forms of racial prejudice. Research on brain size and intelligence virtually ceased, and the literature underwent vigorous critiques (Gould, 1978, 1981; Kamin, 1974; Tobias, 1970). However, as we shall show, modern studies confirm many of the earliest observations.
Reaction Time Measures

Figure 1. Mean brain weight for 4-year age periods in various subgroups. Brain weight is plotted at midpoint of each age period (e.g., the point at age 6 years represents the average for subjects between 4 and 8 years;
White men, open triangles;
Black men, solid triangles;
White women, open squares;
Black women, solid squares).
Differences in brain weights among various groups become apparent at age 6 years. (From Ho et al., 1980, p. 636, Figure 2.)
AGE DIFFERENCES Brain Size
Autopsy studies show that brain mass increases during childhood and adolescence and then, beginning as early as 20 years, slowly decreases through middle adulthood, and finally decreases more quickly in old age (Dekaban & Sadowsky, 1978; Ho et al., 1980; Pakkenberg & Voigt, 1964; Voigt & Pakkenberg, 1983).
Cognitive Ability
General intelligence shows concomitant increases during childhood and adolescence and then (slow) decreases between ages 25 and 45, and (faster) decreases after age 45.
SOCIOECONOMIC POSITION DIFFERENCES Brain Size
Nineteenth- and early twentieth-century data from Broca (1861) and others (Hooton, 1939; Sorokin, 1927; Topinard, 1878) suggested that people in higherstatus occupations averaged a larger brain or head size than those in lower ones.
Cognitive Ability
IQ test scores are significantly correlated with the socioeconomic hierarchies of modern Europe, North America, and Japan (Herrnstein & Murray, 1994;Jensen, 1998).
POPULATION GROUP DIFFERENCES
Brain Size

Figure 5. Mean cranial capacity (cm3) for African Americans, European Americans, and East Asian Americans from birth through adulthood. Data for birth through age 7 years from the U.S. Perinatal Project; data for adults from the U.S. Army data in Figure 4. (From Rushton, 1997, p. 15, Figure 2. Copyright 1997 by Ablex Publishing Corp. Reprinted with permission.).
Rushton (1997) analyzed population group differences from birth to age 7 years using measurements of head circumference and GMA gathered on 40,000 children by the U.S. Collaborative Perinatal Project (Broman et al., 1987). The results showed that at birth, 4 months, 1 year, and 7 years, the East Asian children averaged larger cranial volumes than White children who averaged larger cranial volumes than Black children (Figure 5).Within each group, children with larger head sizes obtained higher IQ scores.
Moreover, the East Asian children, who averaged the largest craniums, were the shortest in stature and the lightest in weight, whereas the Black children, who averaged the smallest craniums, were the tallest in stature and the heaviest in weight; the differences in brain size were not due to body size.

コメント